
去年實做 Arduino 的大氣壓強度(高度計)感測模組 Arduino筆記(59):大氣壓強度(高度計)感測模組 GY-BMP280,只能使用數值的方式呈現溫度,想說改用樹莓派來讀取 GY-BMP/E280 的溫度感測值,用 Python 的 matplotlib 繪製曲線圖,用線性圖呈現目前的溫度。

• GY-BMP/E280 x 1
• 連接線 x 5條

如要開啟 I2C介面,可參考 Raspberry Pi 筆記:開啟 I2C、SPI及Serial功能,這篇文章的設定。用以下指令測試一下I2C是否正常?

SD0 接地時, 使用的位址是 0x76,如果將 SD0 接 3.3V時,使用的位址是 0x77。

以下是執行繪製溫度的線型圖程式:


[材料]
• Raspberry Pi 2 x 1• GY-BMP/E280 x 1
• 連接線 x 5條
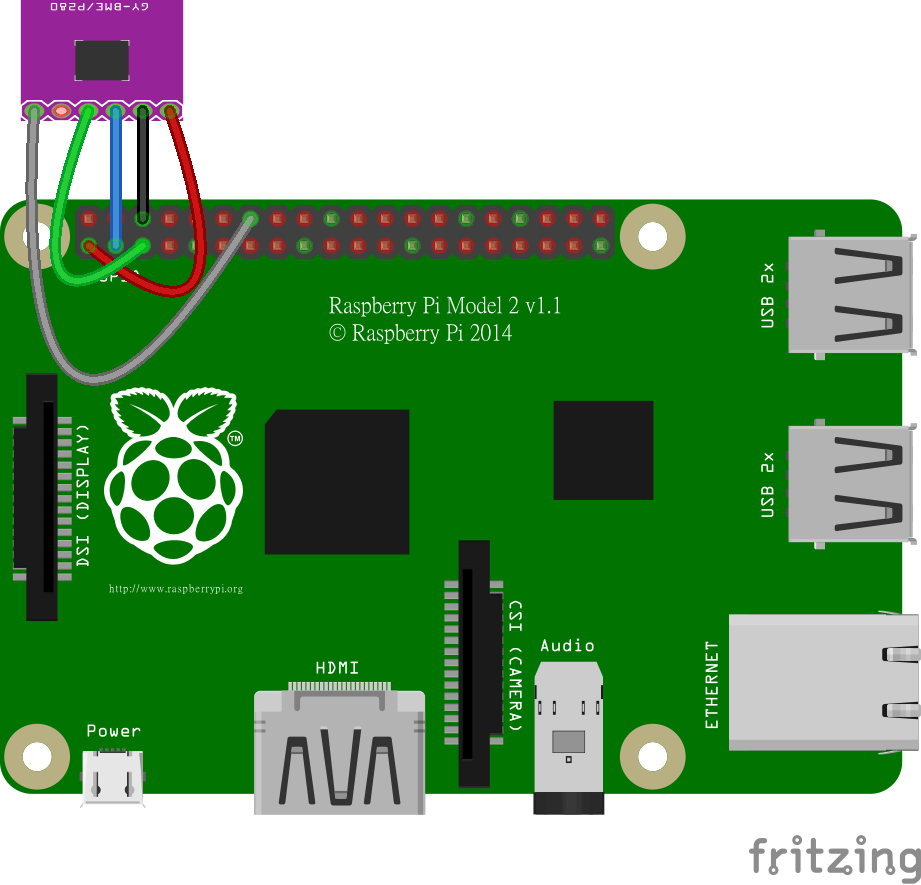
[線路連接與電路圖]
| Pi | GY-BMP280 |
|---|---|
| Pin 1(+3.3V) | VCC |
| Pin 6(GND) | GND |
| Pin 3(GPIO2,SDA) | SCL |
| Pin 5(GPIO3,SCL) | SDA |
| Pin 14(GND) | SD0 |
如要開啟 I2C介面,可參考 Raspberry Pi 筆記:開啟 I2C、SPI及Serial功能,這篇文章的設定。用以下指令測試一下I2C是否正常?
$ sudo i2cdetect -y 1如果有看到以下畫面,就表示可以使用I2C介面通訊。

SD0 接地時, 使用的位址是 0x76,如果將 SD0 接 3.3V時,使用的位址是 0x77。
[安裝matplotlib]
Python 比較著名的繪圖庫是 matplotlib,需要額外安裝才能在樹莓派的圖形介面中顯示繪製的圖形,安裝的方法很簡單,如在 Python 2.7的環境,請執行以下指令進行安裝:$ sudo apt-get install python-matplotlib如果使用 Python 3.7的環境,請執行以下指令安裝:
$ sudo apt-get install python3-matplotlib
[程式]
要讀取 GY-BMP/E280 的感測值,我有使用 Matt Hawkins 撰寫的 BMP/E280.py 程式,如需要程式可到 這裡 下載,或是在 Pi 的終端機視窗中,執行以下指令:$ wget https://bitbucket.org/MattHawkinsUK/rpispy-misc/raw/master/python/bme280.py開啟修改檔案指令,將程式中顯示的部分加上註記,如下圖紅字部分:
$ nano bme280.py

以下是執行繪製溫度的線型圖程式:
import numpy as np
import matplotlib.pyplot as plt
import matplotlib.animation as animation
import bme280
import time

data = [10]

# Initial plot data
dis = np.zeros(100)
dis2 = dis
fig, ax = plt.subplots()
line, = ax.plot(dis)
ax.set_ylim(0, 100)
plt.grid(True)
ax.set_ylabel("Temperature: oC")
ax.set_xlabel("time")

def update(frame):
    global dis
    global dis2
    global line

    # Read Data
    a = frame
    time.sleep(np.random.rand()/10)

    # Generate Data to draw
    temperature,pression,humidite = bme280.readBME280All()
    dis[0:-1] = dis2[1:]
    dis[-1] = temperature
    dis2 = dis

    # Draw
    line.set_ydata(dis)

    # Color
    plt.setp(line, 'color', 'b', 'linewidth', 1.0)
    return line

ani = animation.FuncAnimation(fig, update,frames=data, interval=10)
plt.show()
[執行結果]
我對著BMP/E280吹氣或是按住感測晶片,讓溫度稍稍變化,如下圖:
張貼留言